


Severe and Widespread
Data from the new Local Journalist Index can help leaders invest in, expand, and protect local journalism in underserved communities.
It’s been clear for a while now that we’re suffering from a local news crisis in this country, yet much about it has remained murky.
The State of Local News report produced by Medill does a fantastic job tracking in great detail the number of news outlets that have closed or opened, but what happens in communities where the newsroom remains but the local reporting staff is slashed, or disappears altogether?
Then there are the new players – hundreds of exciting nonprofits, digital natives and hyperlocal websites. How big a dent have they made?
And what about the new forms of storytelling – podcasters, influencers, substackers? They’ve certainly transformed how people get information. Have they helped people get local news?
To have a better shot at reversing the trend, we need to answer a deceptively complicated question: How many local journalists are there?
So Rebuild Local News decided to team up with Muck Rack, the public relations technology firm, to find out.
As we considered the methodology for this analysis, we wanted to:
-
- Use computerized scanning techniques that would allow the project to be regularly updated so we could assess the progress of on-the-ground efforts
- Provide county-level data to ensure usefulness across a wide range of stakeholders (including local philanthropy, entrepreneurs and elected officials)
- Put the numbers in the context of population size
The new Local Journalist Index report reveals that the shortage of local journalists is more severe and widespread than we had anticipated. Click here to explore the interactive map and read the full report.
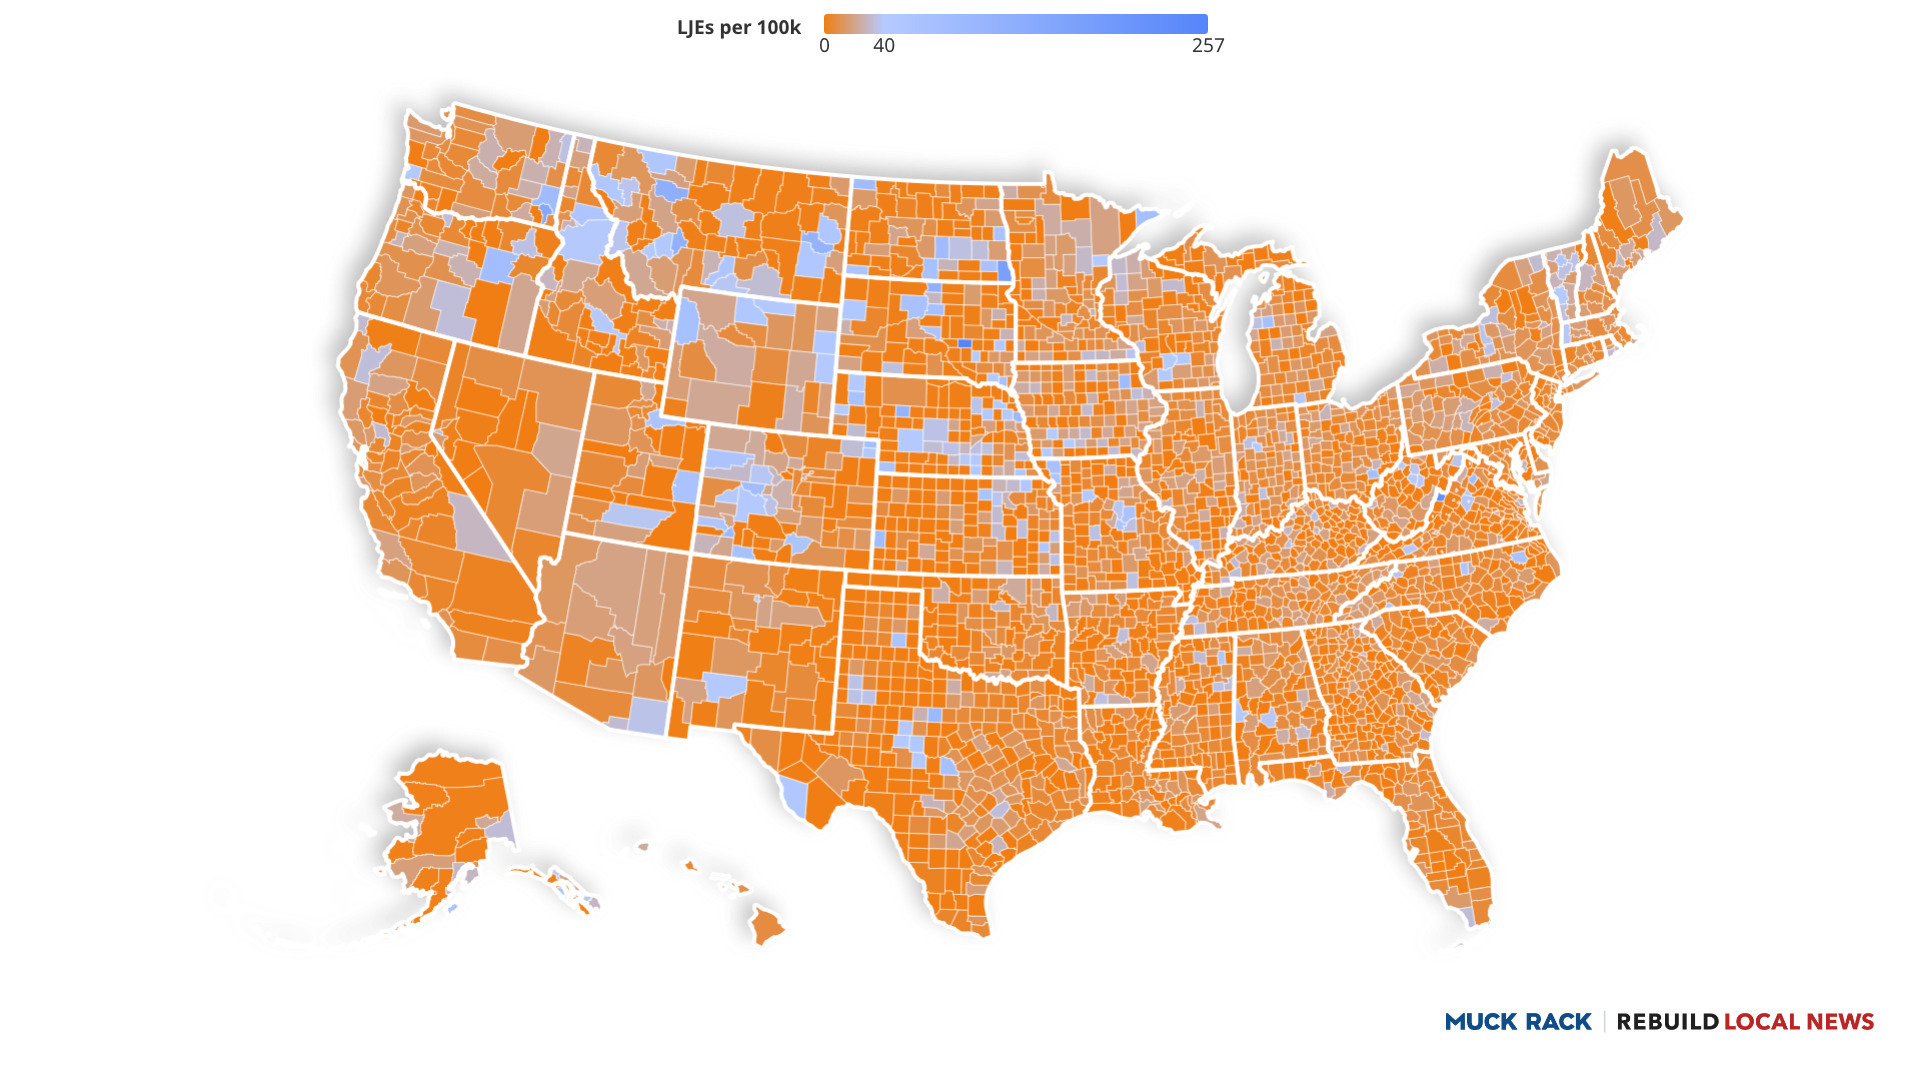
In 2002, there were about 40 journalists per 100,000 residents on average. Today, our study finds, there are 8.2 Local Journalist Equivalents per 100,000 residents. A Local Journalist Equivalent or LJE is a new measure – akin to a Full-Time Equivalent or FTE used in other workplace settings. (Methodology here). That’s about a 75 percent decline in journalists covering local communities.
More than two thirds of the counties, home to 217 million people, have less than even that already-degraded national average.
For smaller towns, the situation is often bleak. More than 1,000 counties do not have the equivalent of even one full-time journalist covering the community, putting their health, physical, mental and financial well-being at greater risk.
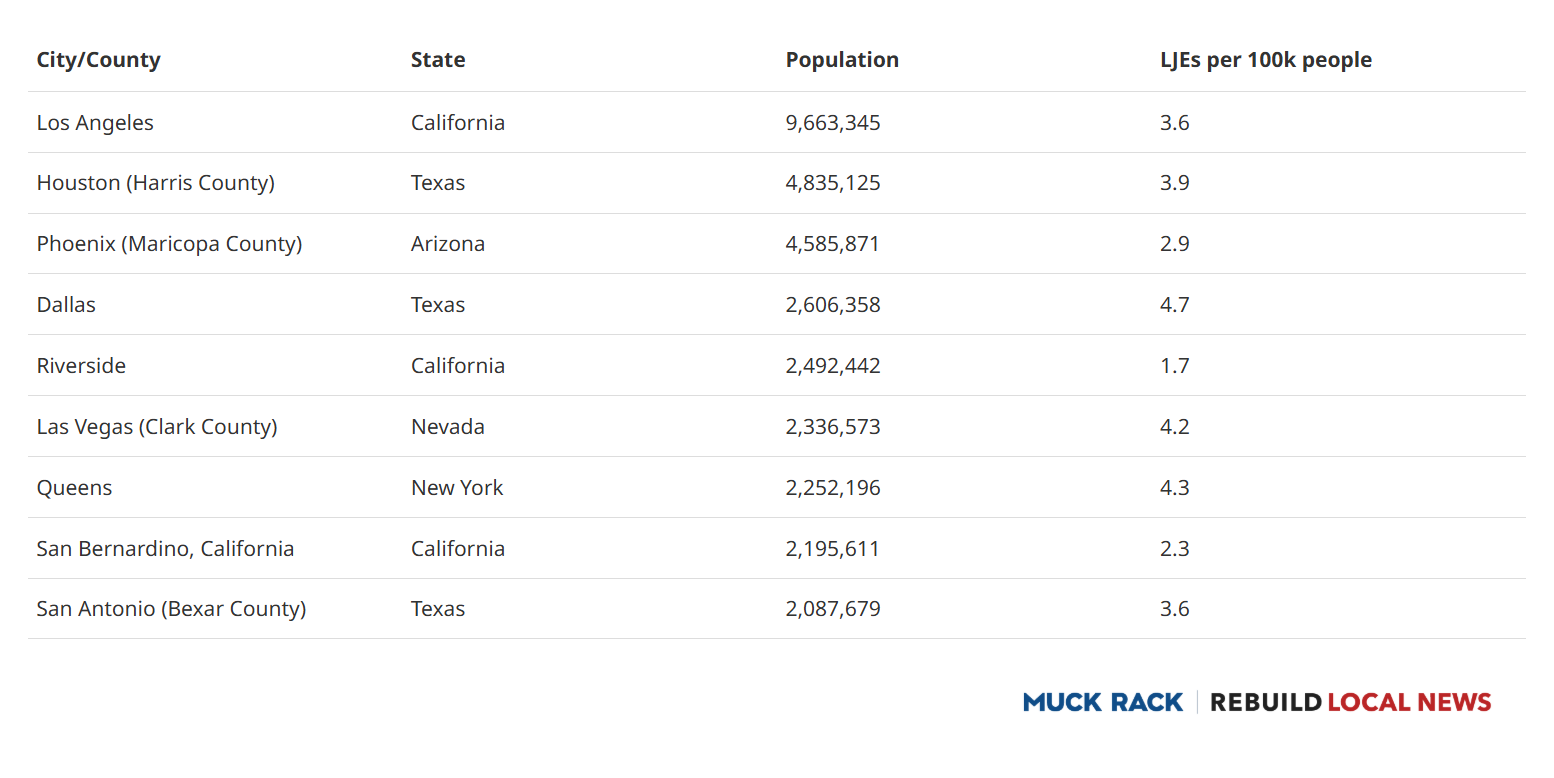
But unexpectedly the situation may actually be worse in many big cities. Los Angeles, Houston, Phoenix, San Antonio, Queens, Riverside, Las Vegas, San Bernardino and Dallas – they all have reporter averages that are half of the already-way-too-low national average. Phoenix is the capital of the state and yet ranked in the top five worst cities when it comes to the number of journalists.
When these journalists disappear, the effects ripple throughout the whole local news food chain. When the local news ecosystem functions well, reporters provide not only verified information directly to readers but also the material for the commentators, repackagers, social-sharers, and amplifiers. If the plankton die off, the rest of the fish will starve.
Why does the contraction of local reporting matter? There’s abundant evidence that local news shortages lead to all sorts of concrete harms — more corruption, higher borrowing costs, more pollution, and less civic participation.
More subtly, the vacuums created by the contraction are filled by social media, which is more likely to spread misinformation (see Dogs, Haitians eating), and national media, which is more polarizing. We get less news about the high school football team across town and more about villains across the country.
It’s hard for any given person to see how conspiracy videos on YouTube somehow relate to the contraction of local news (though they do). Instead, residents simply see a decline in the quality of community information. The reason is incredibly pedestrian: When a reporter used to cover one county and they now cover four, their pieces will become more superficial. They literally have time to make fewer calls. Maybe that’s how a town ends up with no reporters noticing for months that its member of Congress had dementia and moved into an assisted-living facility.
That’s not a criticism of the journalists who are left. They’re trying, often heroically, to do more with less.
This report is designed to help all the people and organizations who are trying to address the crisis. The insight in the data may encourage entrepreneurs or news managers to expand into low capacity areas. Perhaps philanthropists can more precisely target their funding, take some of the guesswork out of their investments in local news, and better track progress over time.
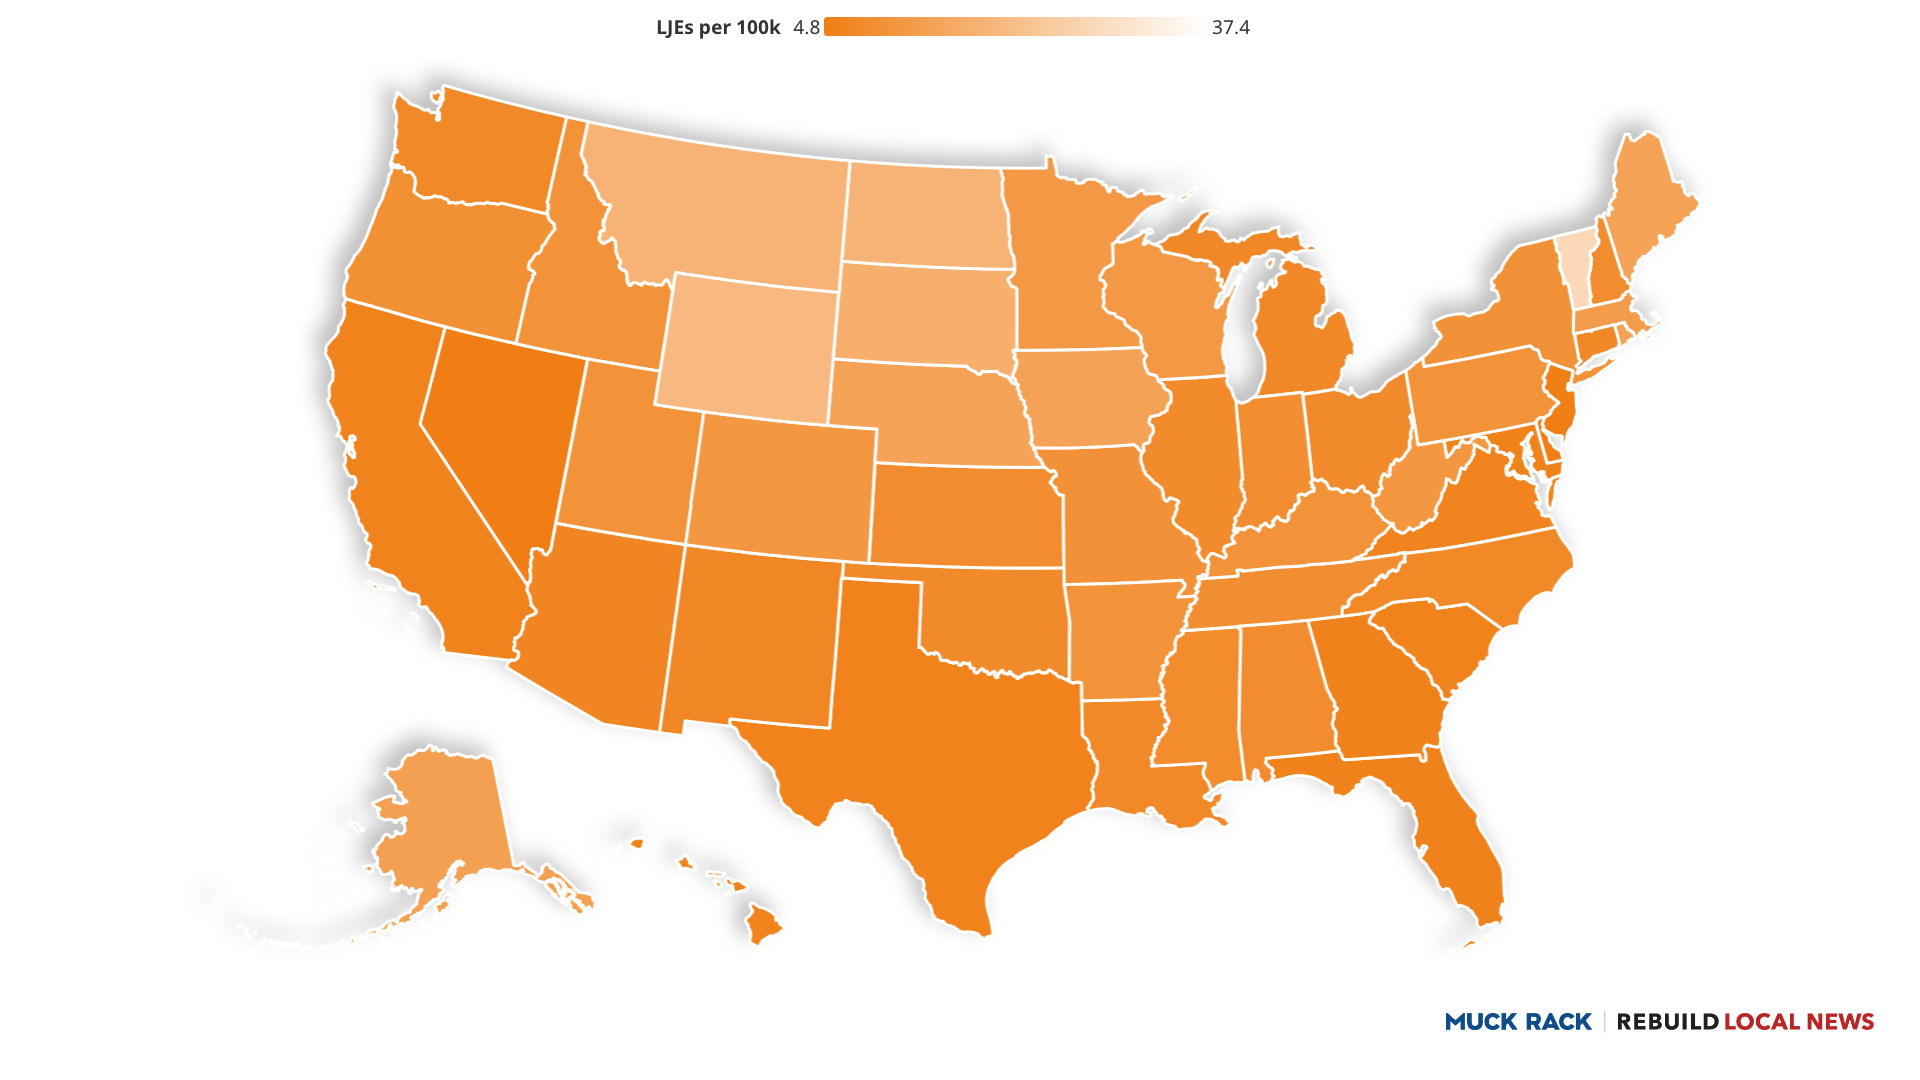
And local stakeholders can leverage the data to better argue for public policy changes at the county or state level to help sustain local news. Politicians who live in the states or counties with the biggest shortages can use that information to push for legislation, as lawmakers have in Illinois, with an employment tax credit to hire journalists, and New Mexico, where they set up a fellowship program to place journalists in local newsrooms. Or to revisit recent decisions to cut way back on efforts to help local news, such as in California which is among the ten worst states.
Indeed, hundreds of newsrooms have been created in the last few years alone, trying hard to fill the local news gaps. Which are succeeding, and what can the new data tell us about why? We suspect that understanding the thickness of full-time reporter distribution could strengthen the excellent efforts to train citizens to better cover their communities. Those models work best when there are sufficient numbers of professional journalists in town too.
If you’re curious about how this came together, check out the detailed methodology section in the Local Journalist Index. It’s a unique collaboration between Rebuild Local News and Muck Rack, a public relations technology firm. The assessment includes journalists whose stories run in all types of outlets — print, broadcast and digital, nonprofit and for-profit — as long as their work and their byline also was published on a website.
This report also builds on the superb work of other scholars, including the Medill School of Journalism, University of North Carolina Chapel Hill, Phil Napoli at Duke, Penny Abernathy and many others. This is just the first of many studies we hope will come from this data. Having gone through it, we have as many questions as answers. Here are a few:
What is the ideal number of journalists per population? What’s the bare minimum?
Why are some states doing so much worse than others? The 10 best states have about three times as many journalists as the worst. Why?
What is the political breakdown of these journalist shortage areas?
What is the relationship between the ownership structure – who owns the news outlets – and the likelihood that a state or county will have journalist shortages?
What’s been the impact of nonprofit newsrooms or digital hyper-local startups?
What impact do journalist shortages have on the economic health of a community?
How could we include analysis of the content – and its quality – into future studies?
Others will no doubt occur to you as you click around the map. See what strikes you.
Also, since this is the first significant attempt at a nationwide analysis down to the county level, some details are likely to be missed. We’re committed to continuous improvement. If you find an issue, please communicate with us here.
Yes, on one level this report is pretty damn depressing. But we hope that it also provides us all with tools we can use to reverse the tide, and create a stronger community news system.

Get the latest on local news legislation, industry developments, and more with our monthly newsletter.